
You are using an out of date browser. It may not display this or other websites correctly.
You should upgrade or use an alternative browser.
You should upgrade or use an alternative browser.
What Did You Do Today???
- Thread starter Tony
- Start date
bigone5500
Well-Known Member
Mine won't after all the amazon and banggood packages start rolling in next month...LOL!
bigone5500
Well-Known Member
I'll make it up to her though. I'll get her a bunch of stuff for her cricut.
Tony
Staff member
I have no idea what that is lol....for her cricut.
bigone5500
Well-Known Member
Cricut is a crafting grade vinyl cutter. You can cut up to 12 x 24" sheets of vinyl, iron on, balsa, etc... with it. My wife and daughter make mostly shirts with it.
bigone5500
Well-Known Member
That's exactly what it is.
liquid1
Member
Got a new DX9 Black edition for Christmas today, Spent most of the day tinkering and flying the Nano cps and Msr heli around the house. Noticed a few war wounds on the Nano.
Since the DX7 and DX9 are similiar I hope to just swap over to the DX9 from the DX7 settings and be good to go. I been out of flying for a few years.
Since the DX7 and DX9 are similiar I hope to just swap over to the DX9 from the DX7 settings and be good to go. I been out of flying for a few years.
RandyDSok
Well-Known Member
Since last Weds... I've been working on making a working prototype spreadsheet for a company I build/fix computers for. I almost never do this type of work for others... but they've been a great client and more importantly... they've been needing this done probably for years.
They gather environmental impact data and create reports for oil well companies that gets reported to the State. What I've been working with is data for one company in one area. In this case... currently they gather the data for 65 different oil wells and put it into 7 different spreadsheets. Then they take that data and manually create one or two graphs from it for their report for each oil well. Each time they add data... they got to manually update each graph ( or graphs ) for each of the 65 wells. Basically... it's a logistics nightmare keeping it all up to date ( or even knowing which spreadsheet they need to update ). Now multiply that by each company and area they work with...
On my prototype... I've converted the way they were keeping the data for only two of the spreadsheets and put all of it into just one big database table on one spreadsheet. From that one database list... I've made a single graph that can be used for all of the 65 wells ( instead of having one static for each well ) by just selecting the well they want a graph for with a simple drop down list. All of the data graphing is now dynamic and made on the fly. If they like my implementation... I'll convert the remaining data from the other spreadsheets they update into the database sheet I've made... make their other graph they need for their reports and then all they have to do is input the data into one place ( the database I made ) and they can dynamically create the one or two graphs they need for each of the 65 oil wells.
Here's a screenshot of the resulting working prototype graph I've got for now... This is just showing the depth to ground water in the oil well and the amount of benzene their tests have measured. You can see an incident that happened in around 2001 and also how well their filtering got later in around 2010. The less benzene they find in the water in the oil well itself... the less chance of it leaching into the actual aquifer that drinking water wells in the area pull their water from. They actually test for and track more than just benzene, they just use that one for the reference graph to monitor all of them. If they find concentrations that are too high with that, then they can refer to the more detailed report for the others and to see their levels.
ChopDrifter
Member
Happy New Year to all 
Smoggie
Well-Known Member
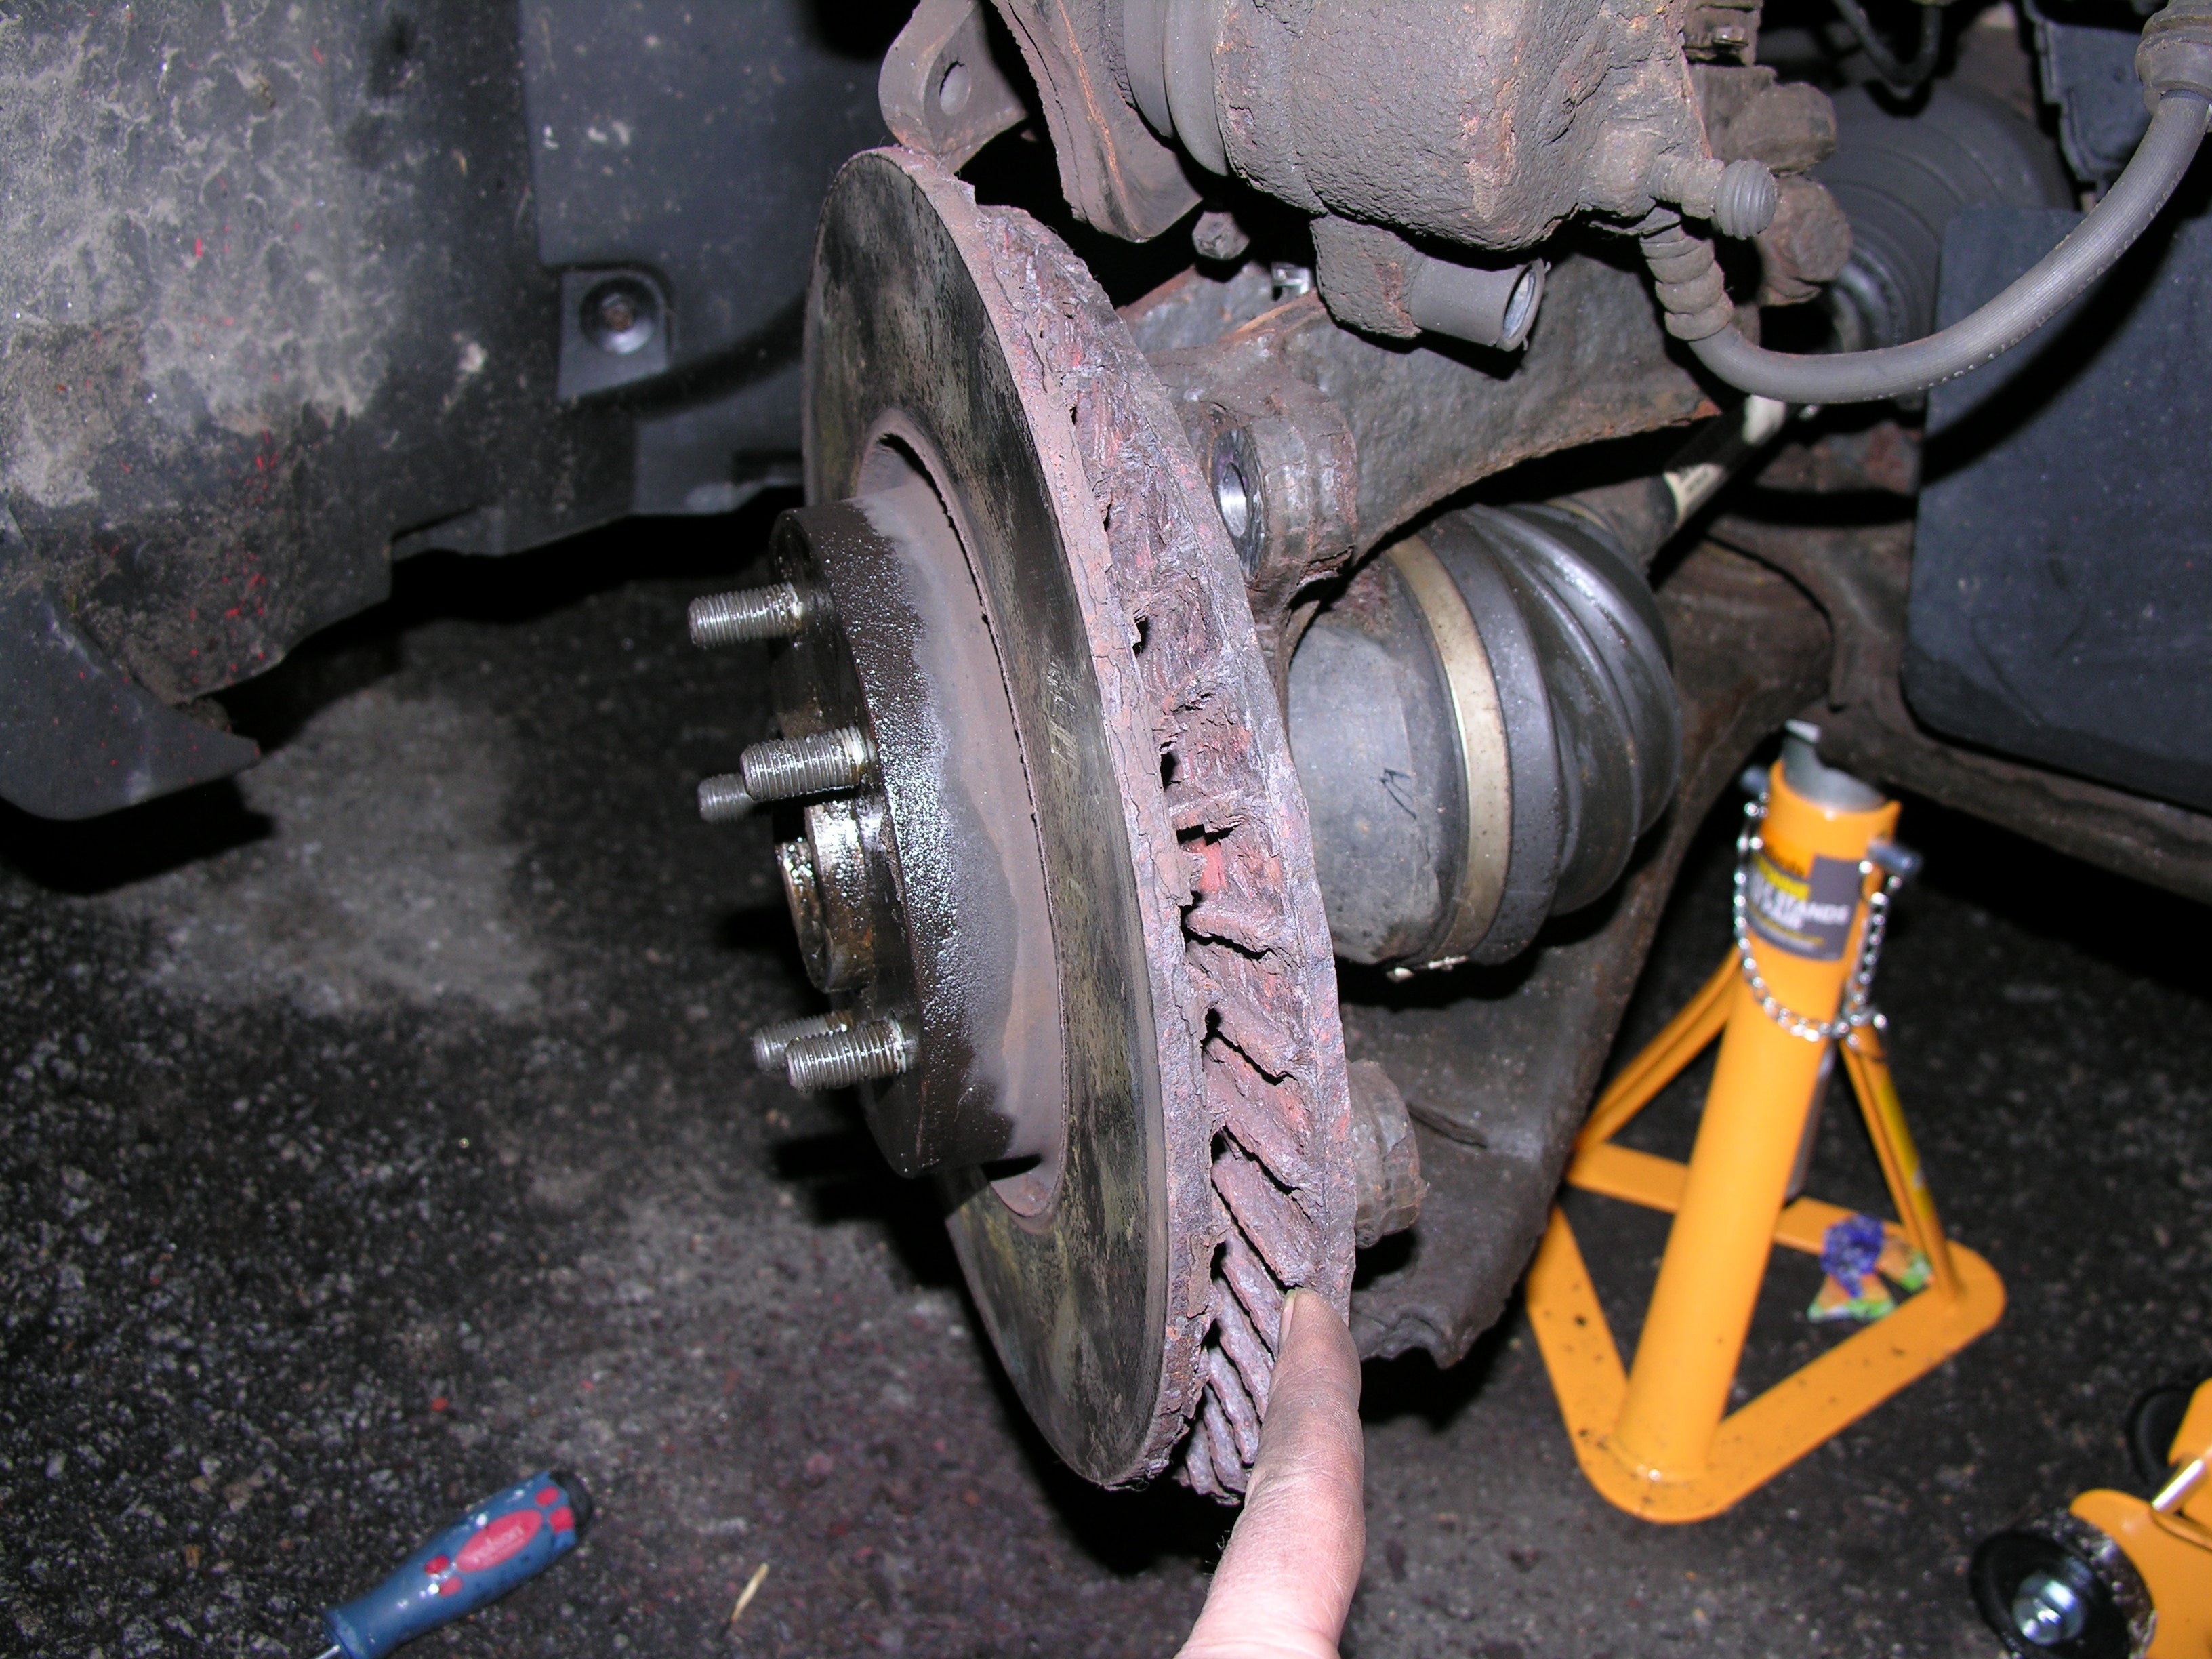
I spent the last couple of days fixing my heli transporter!.. One of the front ventilated discs split completely in two, the inner part seperated from the outer and was rattling around. It made a horrific sound when it went and the feeling of the brake pedal going to the floor and no brakes wasnt very pleasant!
here's the split disc:
here's the split disc:
Smoggie
Well-Known Member
Removing the discs was a job from hell, they corrode theselves onto the hub and cant be moved even with my biggest lump hammer. I ended up whacking them so hard the disc cracked all the way round but still the centre part was stuck solid. In the end it took an angle grinder and a chisel to break the disks into pieces to get them off...
Give me RC helis to work on any day
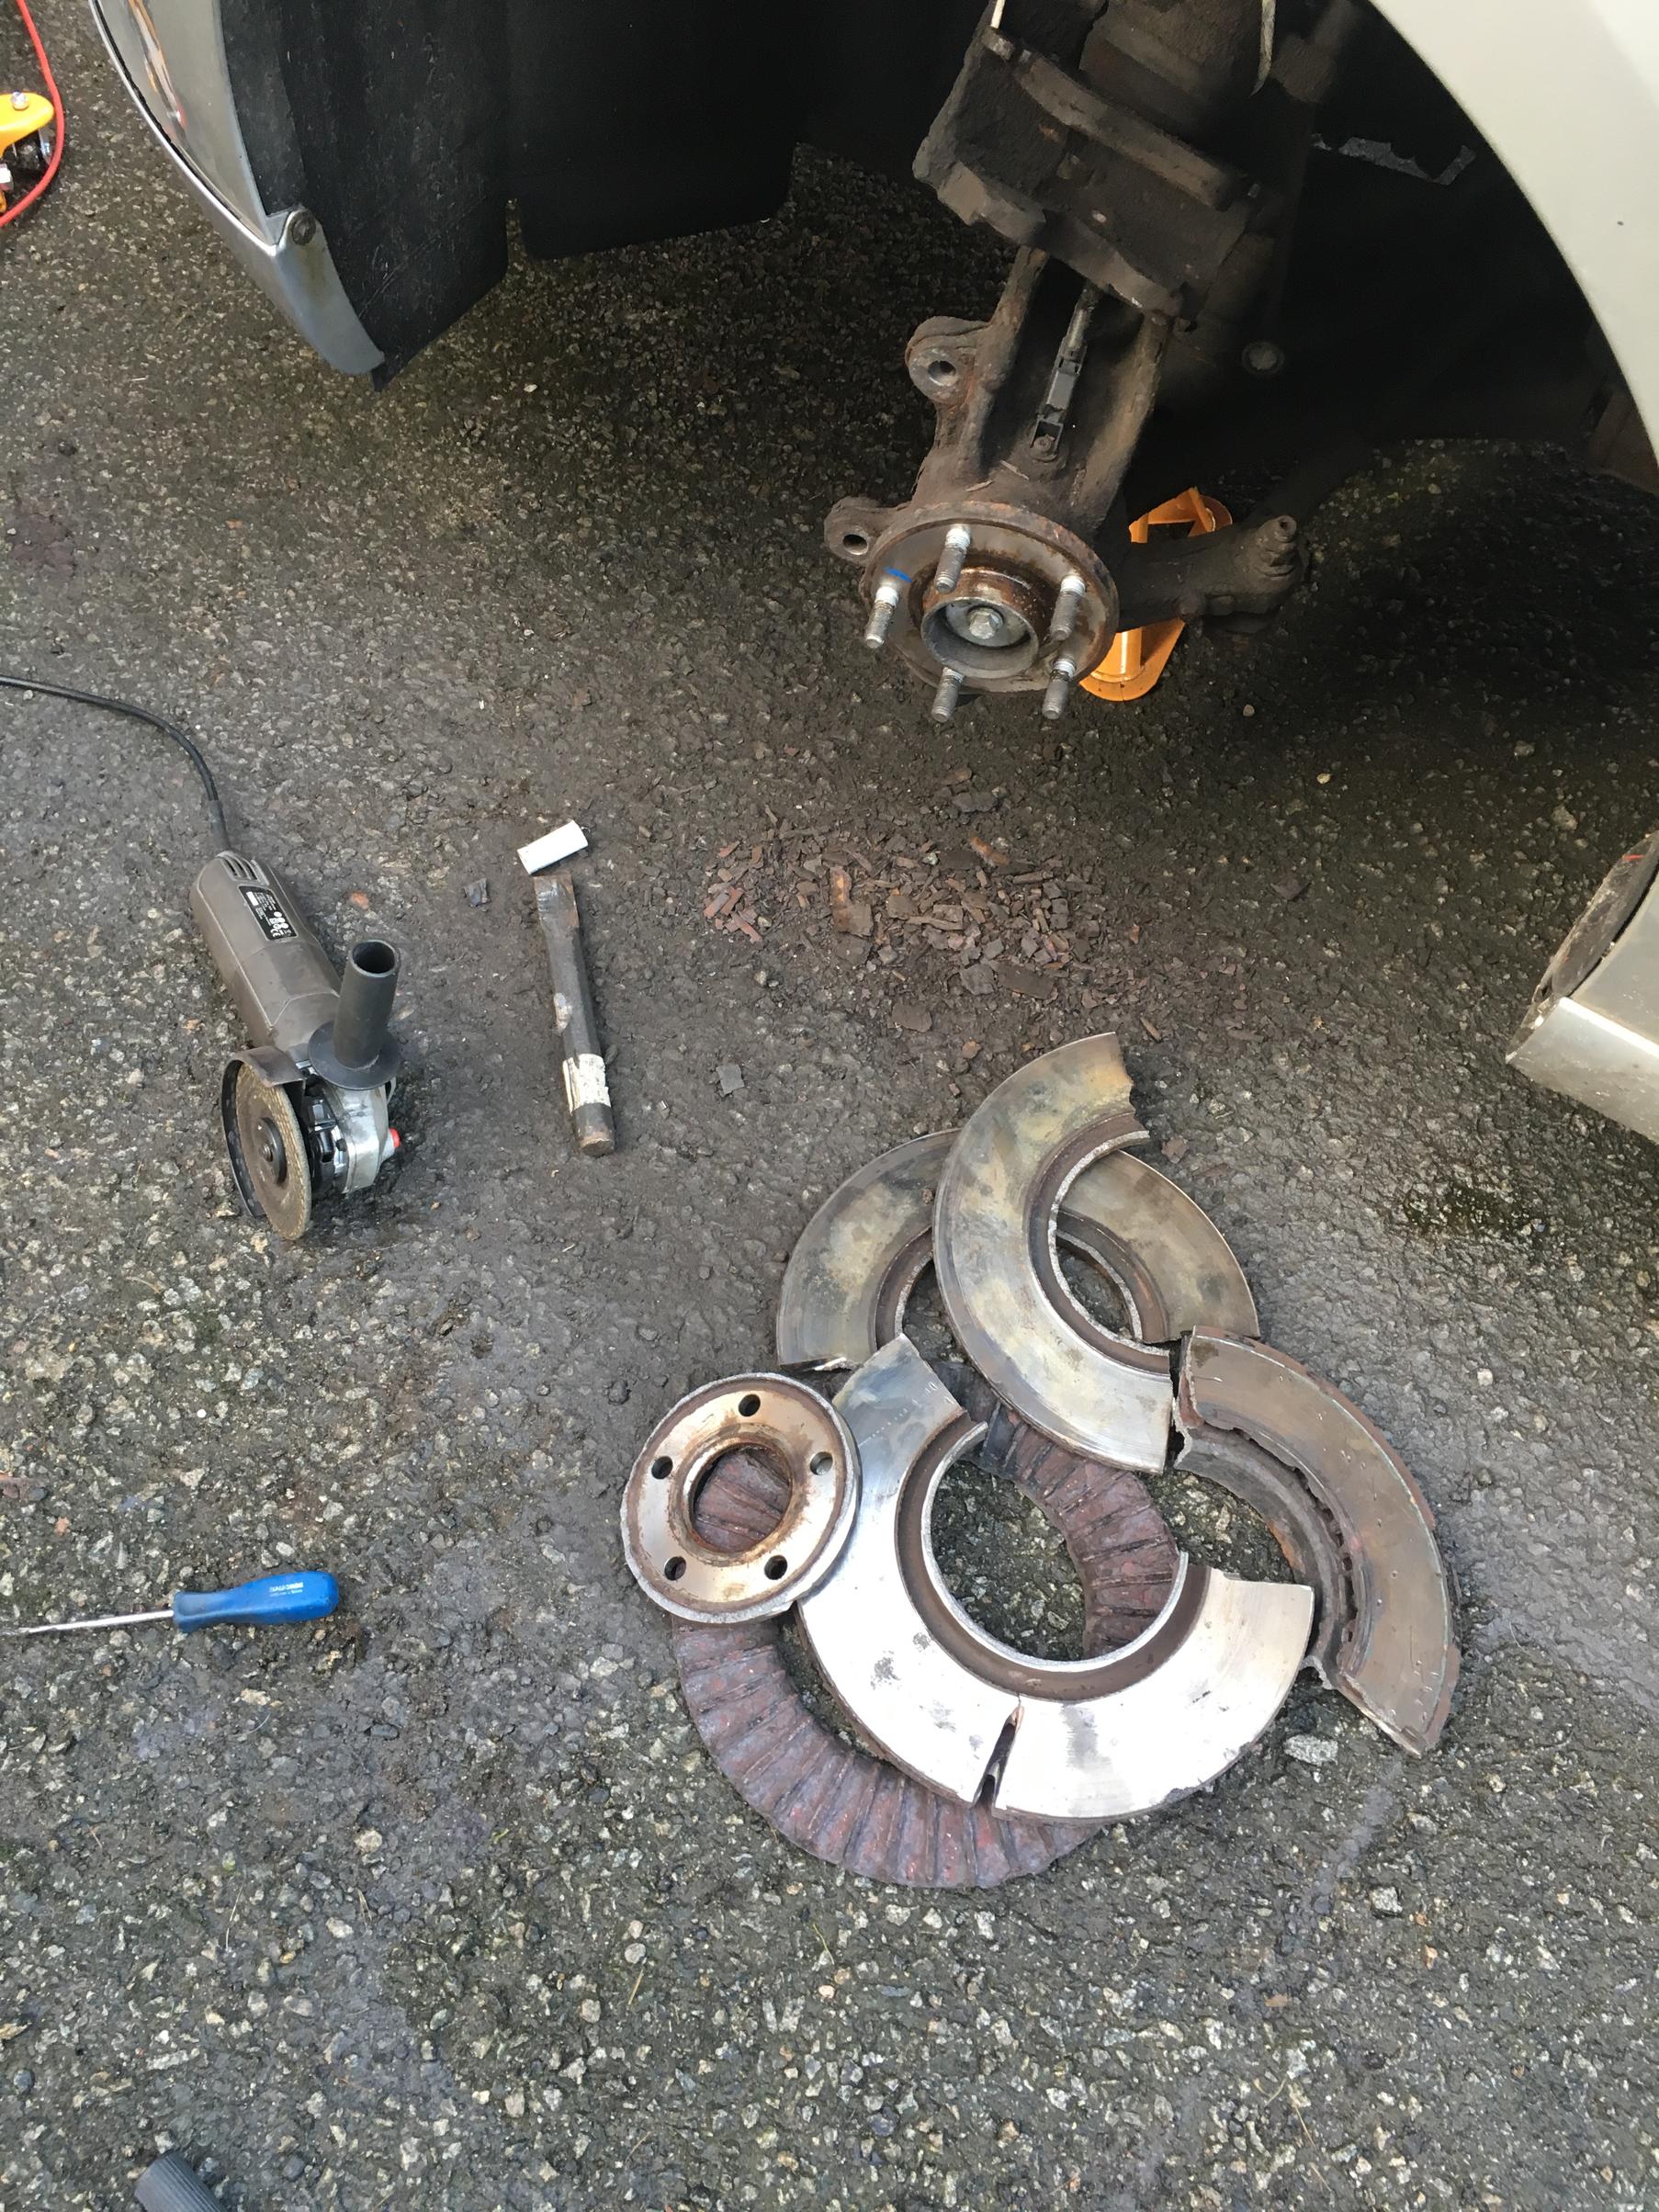
So the heli hauler is back on the road and I might get some flying in tomorrow
Give me RC helis to work on any day
So the heli hauler is back on the road and I might get some flying in tomorrow
Tony
Staff member
Yea. I have been a mechanic almost all my life and I have seen rotors that have had the smooth braking surface ground all the way down to the cooling fins, but I have never seen the fins rust out like that. OH, and the excuse given for the rotors ground down to the fins.... "It just started making noise yesterday..."... lmao.
RandyDSok
Well-Known Member
On the up side...
Last night I finally finished off the Excel workbook ( a batch of spreadsheet is actually called a workbook, I hardly ever call them that... just being technical about it though ). I have 45 hours in it now... started it the Weds before last. So I've finally had a good paying job for once ( even with the hefty discount I gave them )...
The backstory... This is a really good client or I may not have taken on the job since I normally only build/fix computers... not do any programming to speak of. They had been looking for someone to update it for some time since what they had already only worked with Excel 2003 and earlier. Another problem was the guy that originally made the older version is an oil/gas engineer and obviously didn't have a programming mentality at all. The old one had 7 different spreadsheets ( one with just static data that didn't change ) that was used to produce over 50 some charts. Everytime they needed to add data, they had to figure out which sheet to put it in and then manually update all of the charts they produced for the reports they gave to the state ( environmental data for oil wells ).
In the new version I designed... They had only one spreadsheet to update with data and two for static data that didn't change. The 4 charts I created then dynamically update without any additional work so all they have to do now.. is input the data in one place and print the reports they need.